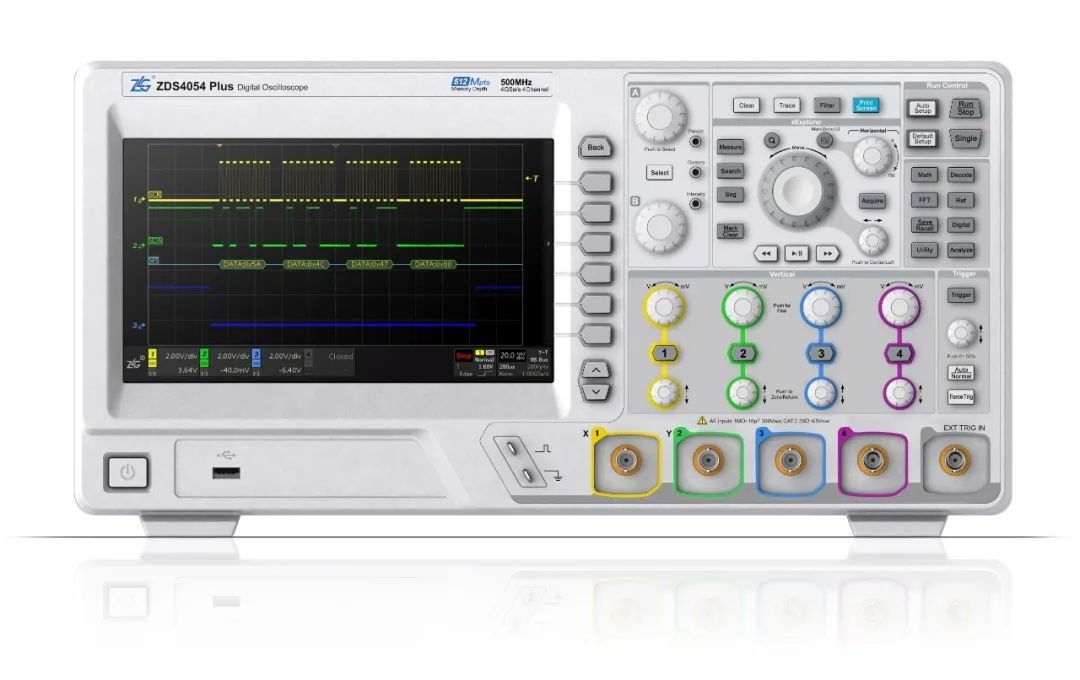
LCD screen debugto showWhen they are abnormal, the driver’s parameters must be modified several times through abnormal phenomena, which is quite heavy. Use the ZDS4054 PLUS long storage oscilloscope to capture the complete reader synchronization, which makes it easy and quick to adjust the LCD screen driving settings!
When LCD screens use multi-screen splicing, synchronization anomalies of frames such as duplication of display image and disparagration are subject to occur. In the past, it is necessary to reverse the derivative according to abnormal phenomena and to debug and to modify the driver’s parameters several times. This method takes time and with a high intensity of labor. Use a long storage oscilloscope to capture the complete reader’s calendar at a time, debugLCDThe controller no longer burns the brain. The following is to analyze the application of ZDS4054PLUS in LCD LCD screen pilot tests via real cases.
Principle of work of the controller and LCD driving
To display the text or the display images of the LCD screen, RGB data must be published at the LCD driver via the LCD controller. The LCD driver puts the data in the cache, then refreshes the LCD screen display at a speed of 60 frames per second.
The LCD controller controls each pixel through different combinations of line signals and column signals. This scanning signal period (HYNC) is very short (up to 40 kHz-100 kHz), allowing stable images to be displayed on the screen.
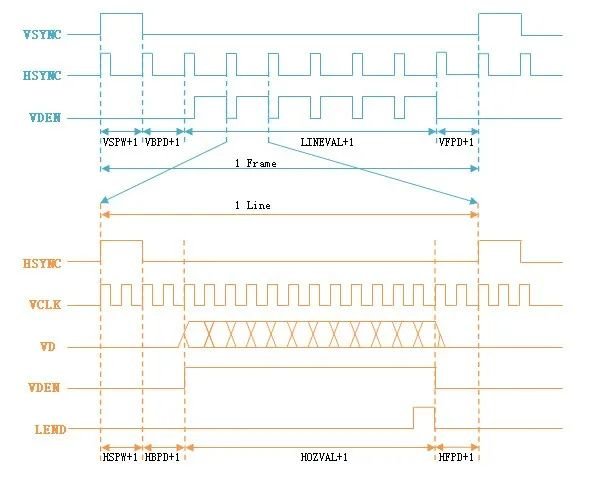
The principle of signal and operating synchronization of the LCD controller is as follows:
Figure 1 Synchronization diagram of the TFT display driver
VSYNC: Synchronization signal of the frame, indicating the start of the digitization of an image, a frame is a screen displayed by the LCD screen; HSYNC: line synchronization signal, indicating the start of the digitization of a line; VCLK: Pixel clock signal, each impulse fills 1 pixel point; VDEN: the data activate the signal, when the high level, the filling data is valid; VD (23: 0): data output port on the LCD pixels. Lend: end of line signal.
By taking an LCD screen 1024×768 pixels as an example, the signal which completely displays a single screen image must contain 1 cycle VSYNC and 768 HSYNC cycles. Each high level VDEN contains a clock signal of 1024 pixels. If there is a problem with the screen, you can check the frame synchronization signal, frequency, service cycle, delay, number of HSYNC cycles contained in each VSYNC cycle and the number of VSCLK cycles contained in the VDEN cycle.
Use the ZDS4054Plus oscilloscope to resolve the abnormal LCD display example
1. Image superposition and repeat
Phenomenon: there is a disalculation, a superposition or a repetition of images on the LCD display. Cause: This situation does not generally occur due to the delay in synchronization of the line or synchronization signals on the ground, and this impact can essentially be excluded. It can be verified if there is a difference in synchronization or clock frequency.
Solution: When meeting this situation, the first thing you need to do is carefully calculate the DMA transmission parameters and accurately adapt the line of line.
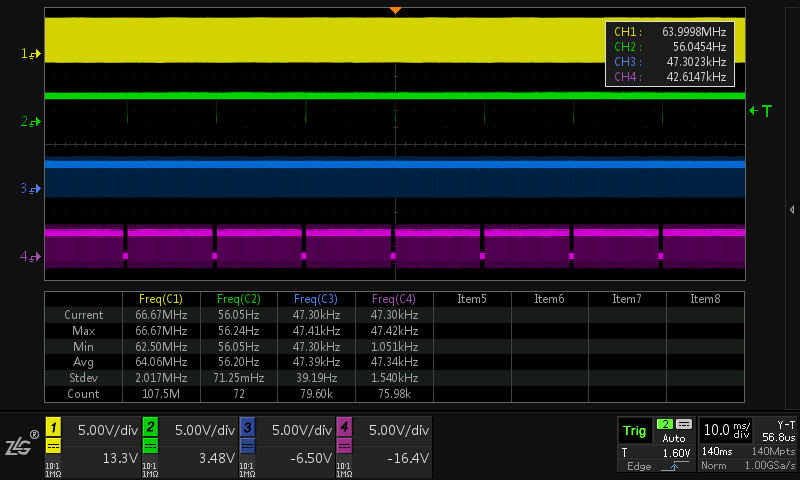
Figure 2 Image superposition and repeated synchronization analysis
As shown in the screenshot of the oscilloscope, the corresponding signals of each channel are in turn VCLK, VSYNC, VHSYNC and VDEN. The analysis steps are as follows:
1) Since the complete signal time of a frame generally reaches more than 30 ms, the oscilloscope must be adjusted to the time base of 10 ms / div, while the frequency of the VCLK signal is generally as high as 48-96 MHz, and that the sampling rate must be maintained at least 500 ms / s in order to analyze the risk. Currently, ordinary oscilloscopes cannot completely capture the waveform.
2) ZDS4054PLUS can always maintain a sampling rate of 1 g / s under the time base of 10 ms / div, and can perfectly restore the waveform. Combined with the standard of the material frequency counter for each channel, it can analyze if there are anomalies in each signal frequency.
2.
Phenomenon: the LCD display is offset horizontally, or there is a color of color, white or black of several pixels at the top or bottom. Cause: in general, this situation is linked to the synchronization of frames and signals of synchronization of lines. If it is a normal anomaly, the initialization parameters may be adjusted incorrectly. If it is an occasional anomaly, it may be that the framework synchronization and synchronization signals of lines are interfed during the work process. Solution: Check the correspondence of the width, the front delay and the back and the polarity of the synchronization and synchronization signal of the field of the controller of the LCD controller.
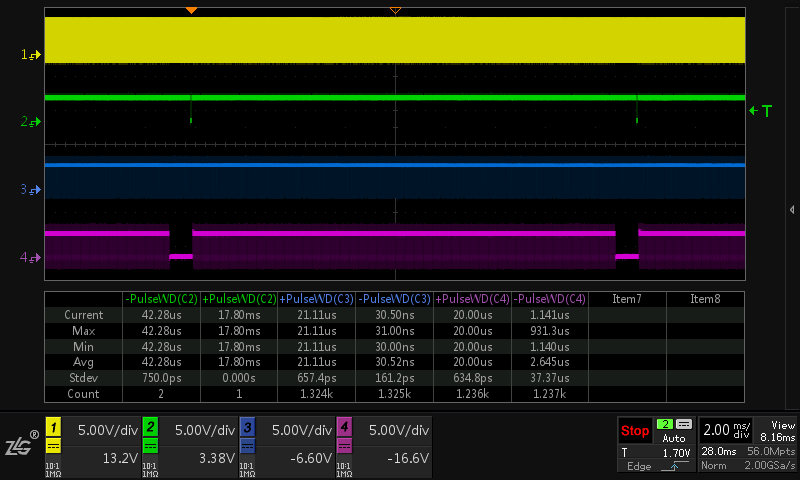
Figure 3 Analysis of image image synchronization
As shown in the screenshot of the oscilloscope, the corresponding signals of each channel are in turn VCLK, VSYNC, VHSYNC and VDEN. The analysis steps are as follows:
1) Thanks to full screen measurement statistics, analyze the positive and negative pulse widths of each signal. If there are aberrant values in the pulse width of VSYNC and VHSYNC, it can be judged as display anomalies caused by the interference signal.
2) If the pulse width is normal, the number of cycles can be calculated by statistics of interval measurement, analyze the direct mutual inclusion relationship between the signals of each period and the period and check the synchronization parameters. 3) Analyze the delay between each synchronization signal by the zoom mode and the measurement of the cursor.

